

Stakeholder mapping is done in four steps: identify your stakeholders, assess their attributes, plot them using a framework, and use the map to plan your engagement. The process typically uses a four-quadrant matrix to visualise each stakeholder's level of influence and interest. Tractivity provides a free stakeholder mapping template you can download to get started.
This guide includes a power/interest grid and a step-by-step guide to completing your first stakeholder map, from identification and categorisation through to communications planning, and when to move from templates to dedicated mapping software.
What is stakeholder mapping?
Stakeholder mapping is a visual representation, usually in the format of a four-quadrant matrix, of the various people that are interested in or are affected by your project (or product, service).
The stakeholder map visually represents a stakeholder analysis and provides a clear picture of your different stakeholder groups, how they are connected, and their relevance to your project. It can include a person, several people or organisations, as well as internal and external stakeholders.
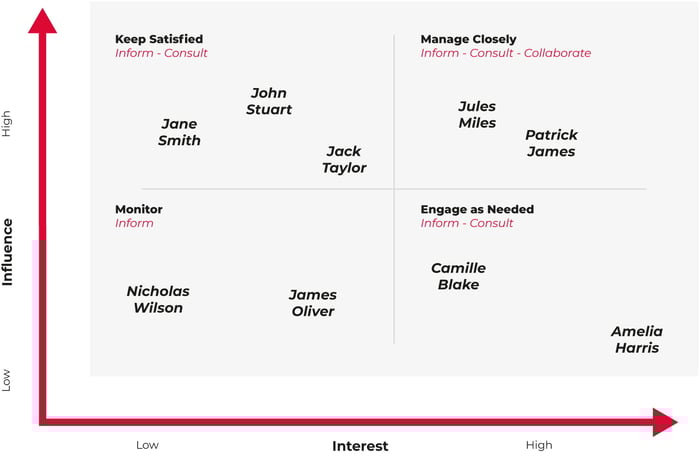
Here’s an example of a stakeholder map:
.png?width=550&name=MicrosoftTeams-image%20(7).png)
In this example, the stakeholders are being analysed according to their levels of interest (how much they are impacted by or want to be involved in your project) and influence or power (how much they can impact the project).
Stakeholder maps can be created using a set of criteria (attributes) that are relevant to your stakeholder analysis. The most common criteria used are interest and influence, but can also be used to assess expertise, relationship, attitude, sentiment, relevance, reputation, sustainability and more.
Based on what’s important for your project, you can choose the criteria you wish to track and analyse in your stakeholder mapping.
Stakeholder mapping methods and models
There are six main stakeholder mapping methods: the power/interest grid, the salience model, the influence/impact grid, the power/predictability matrix, stakeholder relationship (network) mapping, and multi-criteria mapping. Most teams start with the power/interest grid, then add a second method as a project grows in complexity.
Each model plots stakeholders against different attributes, so the right one depends on what you need to understand: who to prioritise, who holds power, who's likely to support or oppose you, or how stakeholders connect to one another.
|
Method |
What it plots |
Best for |
Main limitation |
|
Power/interest grid |
Influence against level of interest |
A fast first pass on most projects |
Doesn't show support or opposition |
|
Salience model |
Power, legitimacy and urgency |
Untangling competing claims |
The labels can feel reductive |
|
Influence/impact grid |
Influence against how much they're affected |
Projects with community impact |
Says little about attitude |
|
Power/predictability matrix |
Power against predictability |
Risk planning on volatile projects |
Few stakeholders are predictable |
|
Relationship (network) mapping |
How stakeholders connect |
Coalition-building, political work |
Hard to build and keep current |
|
Multi-criteria mapping |
Several attributes at once |
Larger, longer programmes |
Needs software to stay live |
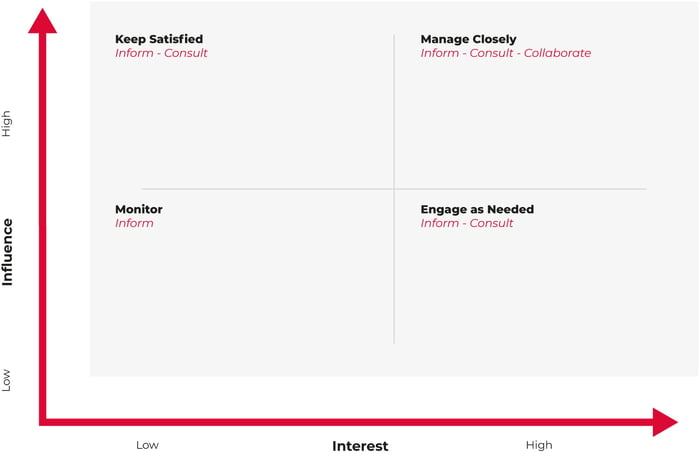
Power/interest grid
The power/interest grid, often called Mendelow's matrix, plots each stakeholder by how much power they hold over your project against how much interest they have in it. The four quadrants tell you who to manage closely, keep satisfied, keep informed, or simply monitor. It's the most widely used method and the best place to start.
Its limitation is that it captures influence and interest but not attitude. A high-power, high-interest stakeholder could be your strongest champion or your loudest objector, and the grid won't tell you which.
Salience model
The salience model, developed by Mitchell, Agle and Wood in 1997, classifies stakeholders by three attributes: power, legitimacy and urgency. Where those attributes overlap you get seven stakeholder types, which collapse into three priority levels. It's useful when several groups are making competing claims and you need to decide whose voice carries most weight right now.
The trade-off is that the labels can feel dehumanising, and the three attributes shift over the life of a project, so a salience map dates quickly.
Influence/impact grid
The influence/impact grid plots how much a stakeholder can influence your project against how much your project will affect them. It's particularly useful in the public sector and on infrastructure schemes, where a community group may have little formal power but be heavily impacted, and therefore deserve genuine consultation rather than a light touch.
Power/predictability matrix
This method plots power against predictability. The thinking is that an unpredictable, powerful stakeholder is the biggest risk to manage. It's a helpful lens for risk planning, though in practice few stakeholders are reliably predictable, so it works best alongside another method rather than on its own.
Stakeholder relationship (network) mapping
Relationship mapping visualises how stakeholders connect to one another, not just to you. It shows alliances, influence chains and where opinion travels, which makes it valuable for coalition-building and political engagement. The catch is that network maps are time-consuming to build and harder to keep up to date as relationships change.
Multi-criteria mapping
Multi-criteria mapping scores each stakeholder against several attributes at once, for example interest, impact, influence, sentiment and the effort needed to engage them, rather than just two axes. It gives a fuller, more honest picture and lets you segment and prioritise with more nuance.
Doing this by hand is impractical, which is why it's normally done in dedicated software. In an SRM platform the scores link to live contact records, so the map updates itself as positions change, instead of becoming a snapshot that's out of date by the next project review.
Why is stakeholder mapping important?
Stakeholders can be the difference between a project’s success or failure. Therefore, understanding and managing their expectations regarding your project is essential to support positive outcomes.
Stakeholder mapping is the first step to creating an effective communication plan that will help you keep your stakeholders engaged.
Getting this wrong is costly. PwC found that 57% of projects fail because of a breakdown in communications. And the spreadsheets many teams still map in carry their own risk: a University of Hawaii study found that 94% of spreadsheets contain errors. Without knowing the levels of interest and power your stakeholders hold, you can't judge how much information they need, how often to contact them, or through which channels.
In practice, many organisations choose to use a stakeholder management system that offers a built-in stakeholder mapping tool. Using software makes the mapping process much easier, centralising all stakeholder data, generating influence and interest analysis, and keeping engagement insights up to date as the project evolves.
On large programmes, the numbers climb fast. Anglian Water, for example, manages more than 13,000 stakeholders on its Cambridge scheme in Tractivity, all mapped, segmented and tracked in one place.
The stakeholder mapping benefits
Building a stakeholder map will enable you to:
- Categorise your stakeholders (and understand their needs)
With a stakeholder map, you can identify the various stakeholder types and group them according to their level of importance for your project. It also allows you to identify the key stakeholders of your project so you can engage with them from the very start.
- Determine the best communication methods
By knowing how many stakeholders you must engage with and the level of information they require, you will be able to select the appropriate communication channels to keep them happily informed and engaged.
- Allocate time and effort more efficiently
Learning who and how you will engage with your stakeholder groups will prevent you from wasting time and effort, as you will be able to properly allocate time between those who require more dedicated attention and those who need less frequent communication.
- Obtain valuable insights
Good communication with your stakeholders will result in gathering valuable feedback from them. They can provide important insights and help fill in project gaps, especially those who have a high level of expertise related to your project.
- Mitigate risks
Considering your key stakeholders’ perspectives can help you uncover potential risks and take action, allocating resources to prevent them from happening and keeping your project on track.
How to do stakeholder mapping
Here are the steps on how to create a stakeholder map and get you started with your stakeholder mapping process:
Step 1: Identify your stakeholders
Based on the project and its objectives, start by creating a list of all its potential stakeholders, from people and groups to organisations. Consider everyone who may be affected by or can have an influence on or an interest in your project and its outcomes.
Do not remove or disregard anyone just yet. The more granular you are, the better to ensure you have considered all relevant stakeholders. As your project evolves, you may need to update your list, adding or removing stakeholders.
For each stakeholder, capture their name, organisation, role, which project or scheme they relate to, how they prefer to be contacted and any consent or opt-out you must respect under UK GDPR. Add a column for current sentiment, even a simple positive, neutral or negative. The register is the source; the map is just a view of it.
Step 2: Assess your stakeholders
Once you have your list ready, you will analyse your stakeholders to identify types so you can group them into categories.
You can group them by how much they can influence the project, for example, how much involvement they have in it or their level of engagement.
Categorising stakeholders will help you later view who your key stakeholders are in your stakeholder map.
Score each stakeholder from one to five for power (their ability to affect the outcome) and interest (how much the outcome affects them or how closely they’re watching). Two rules keep the scores honest. First, agree what a three means before anyone scores. Second, score against the decision at hand, not the job title: a parish council with a judicial review solicitor has more power over a planning application than its size suggests. Score with colleagues rather than alone; different teams often hold different halves of the picture.
Step 3: Plot your stakeholders
This is where the proper mapping happens.
Using a simple four-quadrant matrix, select the attributes you want to analyse and start plotting your stakeholders according to the axes.
Here's a stakeholder mapping example, using the influence and interest attributes:
As mentioned in step number 2, this visual map will help you identify your most influential stakeholders, as well as the ones who have less impact or influence.
Then interrogate the outliers. Anyone sitting in high power, low interest deserves a second look: regulators and elected members often sit there quietly until a milestone moves them sharply right. A 30-minute workshop challenging placements is worth more than a polished map nobody argued over.
Step 4: Plan your engagement
With your stakeholder properly mapped, you now have detailed information to design a communications plan that considers the different levels of engagement for each group.
According to their position on your map, you will know who must be managed closely and who just needs to be monitored.
Here's an example of a stakeholder engagement matrix used to plan communications:
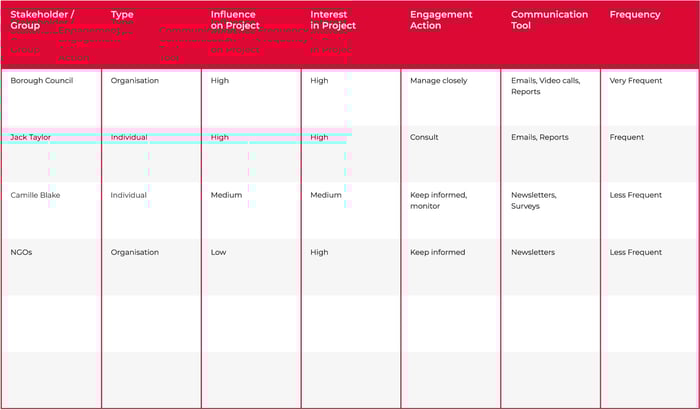
This way, you're able to plan the right number and type of communications, providing more detailed and deeper engagement for key stakeholders while delivering a more general engagement to stakeholders that have lower levels of interest and influence.
Quadrants are a starting point, not a verdict. A low-power community group can still derail a scheme’s legitimacy if it’s ignored, which is why the Gunning Principles expect consultation to happen when proposals are still at a formative stage. One caution from public-sector practice: stakeholder maps held by public bodies can be disclosed under the Freedom of Information Act. Write every assessment as if the stakeholder might read it, factual, evidenced and free of personal judgement.
Stakeholder mapping considerations
Stakeholder mapping is a great technique to grasp the relationship between your project and its stakeholders. And just like in any relationship, there can be positive or negative changes.
That’s why it’s important to keep track of your stakeholders and their views by reviewing your mapping. Set a light monthly review to re-check the top two quadrants, and a full re-score at each project milestone, or immediately after elections, reorganisations or consultation stages. Date-stamp each version so you can show how your understanding evolved. A map older than three months is a hypothesis, not a record.
Conducting these reviews will provide you with helpful insights into how clearly you are engaging with your stakeholders and how satisfied they are with how (and when) you communicate with them.
This is valuable information you can use to further refine your communications and ensure you meet your stakeholders’ expectations.
What mistakes should you avoid?
Five failures account for most abandoned maps:
-
Using a matrix with no register behind it, so nobody knows why placements were made.
-
Mapping once and never again. Scoring on job title rather than actual influence over this decision.
-
Writing assessments you couldn’t disclose under FOI.
-
Treating the map itself as the plan, when it’s only the argument for one.
Free stakeholder mapping template
Tractivity offers a free stakeholder mapping template you can download instantly. It includes a power/interest grid and a step-by-step guide to completing your first stakeholder map.
The template is available to download as a PDF and covers:
- A blank four-quadrant power/interest matrix ready to populate
- Guidance notes on how to score and plot each stakeholder
- A communications planning matrix aligned to each quadrant
- Tips on how to categorise stakeholders by influence, interest, and engagement level
Download the stakeholder mapping guide with templates.
If you want to go deeper before mapping, start with a stakeholder analysis, the process of assessing your stakeholders' needs, motivations, and relationships before you begin plotting them visually.
Consider how much time and resources you have to dedicate to your stakeholder mapping process.
If you’re managing a large project with many stakeholders, manually analysing and mapping each one of them will take a considerable amount of time when using spreadsheets or other similar types of tools.
Using a proper stakeholder mapping tool, such as software, can save you hours of time and effort.
With a stakeholder mapping feature like Tractivity’s stakeholder mapping module, you can easily add all the attributes you wish to monitor, assign scores to your stakeholders against these attributes and analyse them in a chart with the click of a button, with no need to manually plot each one of them.
In addition, it allows you to add multiple phases to keep track of your stakeholders’ evolution and create distribution lists based on their scores and reports.
If you want to compare more options first, our roundup of free stakeholder mapping templates reviews seven, from Excel workbooks to online whiteboards.
Support the success of your projects with
stakeholder mapping
Dedicating time to work on stakeholder mapping and analysis is an essential step to avoiding obstacles and issues with your project further down the road.
Successful projects rely on effective stakeholder management and collaboration, and the stakeholder map process plays a key role in supporting better communications and engagement.
Tractivity is the leading stakeholder engagement system in the UK, helping many small and large organisations effectively engage with stakeholders and deliver better outcomes.
Organisations like National Grid, EDF Energy and Anglian Water use it to map and manage stakeholders across some of the UK's largest infrastructure programmes.
Learn more about how we can streamline stakeholder mapping and engagement for you. Book a free demo.
